Bitrix24 CRM Analytics for Real Estate Managers: What to Read First
👉 Book a free 30-minute Bitrix24 demo
Open any CRM report page for the first time and you are met with charts, tables and filters. It is tempting to look at everything or at nothing. If you manage a real estate sales team, neither helps. You need a short reading order that answers the questions managers actually ask on a Monday morning: where are we losing deals, who needs support, which sources are worth the budget, and which deals have gone quiet?
This guide is a "what to read first" tour of Bitrix24 CRM analytics for real estate managers. It sticks to reports described in Bitrix24's own help documentation, and it points out where you should check your own plan and setup, because what you see depends on your plan, CRM mode and configuration.
Where to find CRM Analytics
In Bitrix24, CRM Analytics lives under CRM > Analytics > Real time analytics. Reports are grouped by category in the left-hand menu. According to Bitrix24's help documentation, CRM Analytics is available only on the commercial plans, so check your plan if you cannot see it.
One feature is worth learning before anything else: you can filter reports by any field, including custom fields, and you can click a value (such as the number of won deals) to open the list of deals behind it. For a real estate team, custom fields like property type, community or lead source can turn a general report into a useful one. If your pipelines still need those fields, our post on saved filters and smart views for real estate pipelines is a good companion.
Read first: the Sales funnel
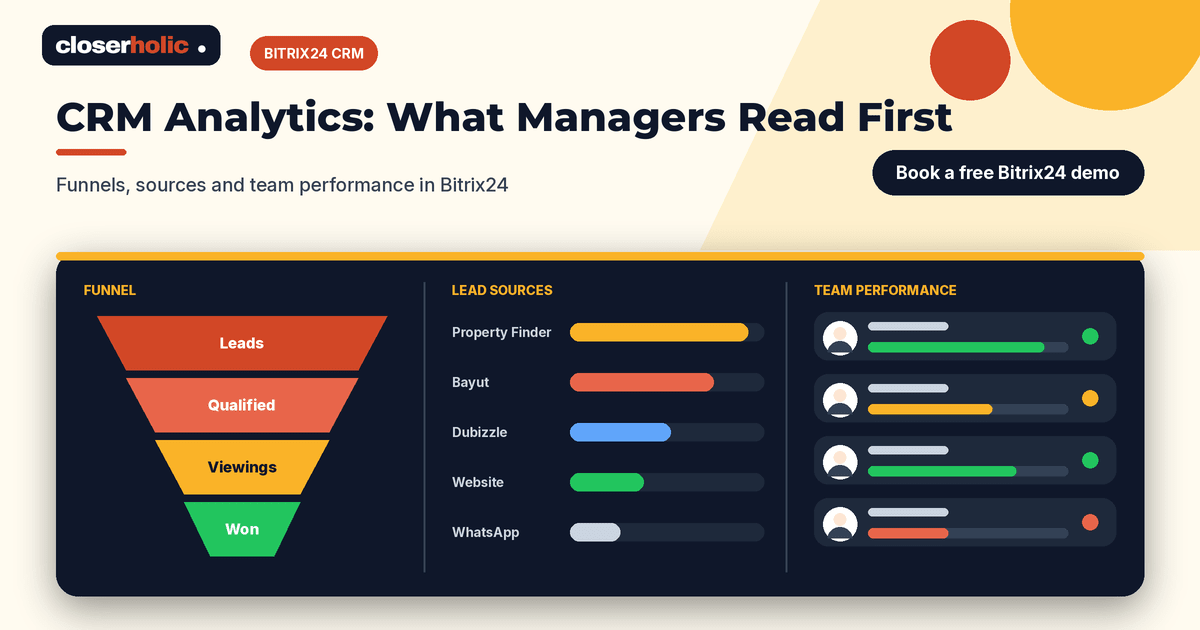
Start with the Sales funnel report. It combines lead and deal funnels and offers two types: classic and conversion.
- Classic funnel: shows only the stages leads and deals actually passed through. Use it to spot stages that are often skipped. If viewings are frequently skipped before offers, for example, your process may not be followed consistently.
- Conversion funnel: shows all stages and highlights where deals are most often lost. Use it to see the point where your pipeline leaks.
Hover over a column to see the number of deals, conversion rate, deal amount and the time deals spend at each stage. That last figure is a manager's friend: a stage where deals wait the longest is a stage to coach.
Illustrative reading
This is a hypothetical example, not real data. Suppose the conversion funnel for your sales pipeline shows many deals stopping after "Viewing done" and few reaching "Offer." The question for Monday's meeting is not "who is weak?" but "what happens after the viewing?" Perhaps follow-up is slow, or the offer paperwork is unclear. The report points you to the right conversation.
Read second: Employee performance
Below the Sales funnel sits the Employee performance table, which helps you see how well each person handles leads and deals. Use it for coaching, and filter by deal type first: an off-plan specialist and a rentals agent work at very different speeds.
Want your reports set up around your own pipeline and fields? Book a free 30-minute Bitrix24 demo and we will show how a real estate CRM setup can feed useful analytics.
Read third: Sales plan and Sales trends
Bitrix24 also provides a Sales plan report, which helps you plan money flows and control employees' productivity, and a Sales trends report, which shows how deal amounts change during the reporting period and lets you compare repeat and initial deals.
Read fourth: Sales Intelligence for lead sources
If you spend money on ads, the Sales Intelligence reports answer which source gives the best return. You will find them at CRM > Analytics > Real time analytics > Sales Intelligence > Reports. There are two:
- Advertising ROI: shows which source generates more revenue and has a higher conversion rate.
- Traffic report: evaluates how effectively managers work with each traffic source.
There is an important condition: according to Bitrix24's help article, these reports only appear once at least one source has a UTM parameter. Even if you have untagged traffic, the reports will not appear until at least one source is properly tagged. So tagging is not optional if you want these views. Our UTM naming template for UAE property campaigns helps you start with consistent names.
Portal enquiries, calls and WhatsApp messages do not always carry UTM tags, so decide how you will record their source in the CRM.
Read fifth: My reports for deal hygiene
The My reports: Deals section is useful for housekeeping. Bitrix24's help article describes two widgets that suit property teams well:
- Payment control for deals won: helps you find won deals that have not been invoiced. Closing a deal does not always mean the payment was received, so this is a good check for commission and fee follow-up.
- Number of deals on hold: helps you find inactive deals. A deal counts as on hold if nobody worked on it during the selected reporting period, and you can click the number to open the list.
Review the "on hold" list weekly. Every deal on it is either a deal to revive or a deal to close as lost, and both outcomes clean up your forecast.
A weekly 30-minute reading routine
- Minutes 0 to 10: Sales funnel. Open the conversion funnel, find the stage with the biggest drop and note one question to investigate.
- Minutes 10 to 15: Employee performance. Look for agents who need support, filtered by deal type.
- Minutes 15 to 20: Sales trends and plan. Compare this period against your target.
- Minutes 20 to 25: Sales Intelligence. If it is available, check which source delivers revenue and not just volume.
- Minutes 25 to 30: Deals on hold and payment control. Assign follow-ups.
If your team is also reviewing portal results, combine this routine with our portal listing performance review template.
Reports are only as good as the data
Analytics reflect what your team records. A few habits make a big difference:
- Move deals through stages when things actually happen, not in a batch at the end of the week.
- Always fill the source field for every new lead.
- Close lost deals with a reason, so you can learn from them.
Also check who has access to what. Managers need broad views, while agents may only need their own. Our guide to Bitrix24 CRM access permissions for brokerages explains how to think about roles.
What to verify in your own account
What you see depends on your plan, CRM mode and settings. For example, the help documentation notes that lead analysis appears only in the Classic CRM mode. Before you build a routine around any report, open it in your own account and check the latest help article.
How Closerholic helps
Closerholic implements Bitrix24 for UAE real estate teams, from pipeline and field design to lead source tracking, so that your analytics have clean data to work with. We also build custom real estate CRM setups, websites and portal listing integrations that feed the CRM. If you would like your Monday report to take thirty minutes instead of three hours, we can help you set it up.